
Introduction
In New York City, there were 353,830 total vacant apartments held off the market as of 2021.1 There were 61,000 vacant rent stabilized units, more than initially reported by the NYC 2021 Housing and Vacancy Survey.2 Despite the staggering number of vacant apartments, New York City had an average nightly shelter population of 60,252 people in September 2022, 19,310 of whom were children.3 This is a significant undercount of the true number of housing-deprived people in NYC, as many do not sleep in shelters and instead sleep in public spaces, in cars, or with family members. Coalition for the Homeless explains that limitations in data collection and reporting make it almost impossible to calculate the true number of housing-deprived people.4 This glaring discrepancy begs the question – why are there so many empty units despite such high demand for housing?
To grapple with this question, I will examine the relationship between financialization and rental housing in New York City with a focus on residential vacancies. In the first section, I will provide an overview of residential vacancies in NYC using the 2021 Housing and Vacancy Survey, Social Explorer, and local reporting. Second, I will explore the history of financialization and it’s impact on the fabric of cities, specifically New York. Finally, I will draw connections between financialization and residential vacancies, and provide avenues for future research.
Residential vacancies
SOCIAL EXPLORER
Social Explorer is a map-making tool created by the CUNY Graduate Center. It allows users to create maps across the United States using different datasets. I created maps measuring vacancy rates across NYC to understand the landscape of empty residential units.
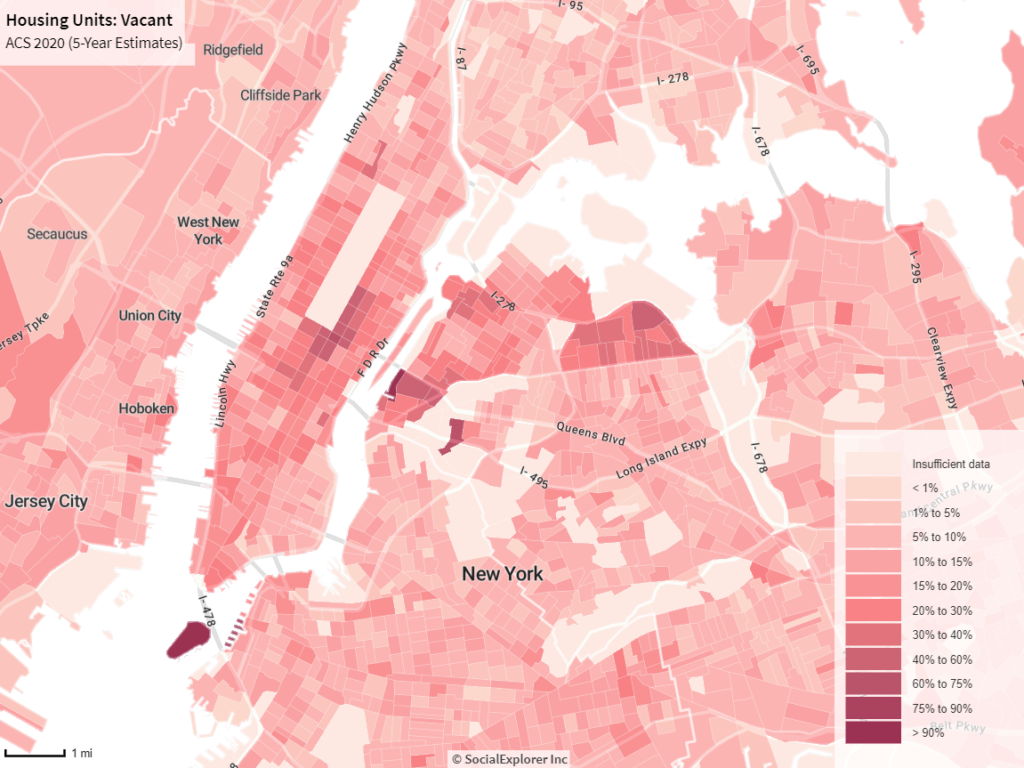
Vacancy rates in 2020 by census tract. Data from the 2020 American Community Survey.
The above map illustrates the rate of housing vacancies in Manhattan and parts of the Bronx, Queens and Brooklyn. The darker tones indicate higher vacancy rates, and the lighter tones indicate lower rates. The areas with highest rate of vacancies are Manhattan, specifically Midtown, and Queens, along the East River, in East Elmhurst and Jackson Heights.
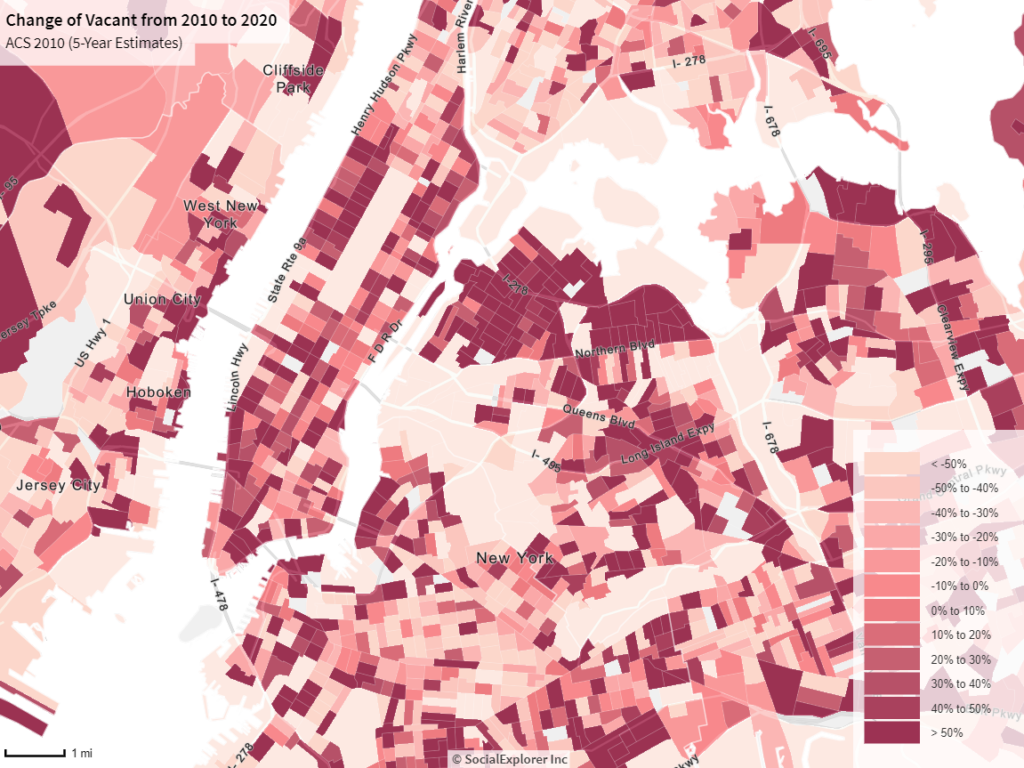
This map shows the change in vacancies from 2010 to 2020, with darker tones indicating an increase in vacancies and lighter tones indicating a decrease in vacancies. The tracts with the highest increase of vacancies are sporadic throughout the boroughs, but concentrate in Manhattan and the upper-West portion of Queens. This data is limited to 2010-2020 time frame and unfortunately does not provide vacancy rates for pre-2010. However, it does offer a snapshot of how vacancies have shifted over the previous decade.
These maps introduce avenues for further investigation. What causes vacancies to rise in certain tracts but not others, even when they are directly next to each other? Are there zoning changes or new developments that contribute to rising vacancies? What are the neighborhood contexts of tracts with higher vacancies versus those with lower ones?
2021 NYC Housing and vacancy survey
The 2021 Housing and Vacancy Survey (NYCHVS) is published by the Department of Housing Preservation & Development and offers a depth of information on housing supply in New York City. This project will focus specifically on the vacancy rate portion of the report. These are the initial findings of the report, and the full data has not yet been released to the public.
The 2021 report revealed that there were a staggering 353,400 vacant units not available for rent or sale.1 Units are considered “vacant but not available for rent or sale if they were vacant for 12 months or longer” (NYCHVS 2021, p.34). NYCHVS Field Representatives report abstract reasons for vacancy, but the survey findings do not provide specifics.

This table gives a breakdown of units not available for rent or sale. It shows that:
- 27% (93,830 units) were ‘not available for two or more reasons, therefore there is no detail on what those reasons are.
- 12,190 units simply did not provide any reason for vacancy.
- 102,900 units, or 29% of total vacancies, were “held for seasonal, recreational, or occasional use” (NYCHVS 2021, p.34).
- The second most reported reason were units ‘awaiting or undergoing renovation,’ with 28,780 units (8% of total vacancies).
- ‘Held for other reasons’ falls closely behind at 27,320 units – 7.7% of all recorded vacancies.
- According to the survey, 42,860 units were rent stabilized, meaning New Yorkers are being denied access to city-regulated housing.
- 38% of vacant units were in condominium or co-op buildings, half of which “were maintained as second homes” (NYCHVS 2021, p.34).
These numbers obscure many intricacies: the amount of time a unit has been vacant (before 2019), if there are plans to bring the unit back onto the market, detailed reasoning for their unavailability, and who owns the property. The report provides only aggregated data, and therefore looking into specific buildings, property owners, or neighborhoods is not possible with the current dataset. This is a different dataset than the 2010-2020 ACS data referenced in the Social Explorer vacancy maps, and it is unclear if the maps reflect the NYCHVS findings.
The NYCHSV survey unveils a massive amount of vacant units that are often ignored in conversations about the city’s housing crisis. The housing crisis is framed as a supply problem. This survey shows that there is ample supply, but no political will to bring it back to renters.

Vacant rent-stabilized units
An internal state memo revealed that there are 61,593 vacant and unavailable rent-stabilized units in NYC, initially reported by Sam Rabiyah for The City.5 This is higher than the 42,860 initially reported in the 2021 Housing and Vacancy Survey.1 The Coalition to End Apartment Warehousing explains that landlords are “creating fake scarcity to raise prices.”5 Landlords are withholding over 60,000 affordable apartments from NYC renters. This inflates median rents which inform rental pricing and create the illusion of a housing shortage to justify building new high-cost developments.
Vacancies offer many benefits to landlords, facilitated by legislation. In 2019, The Housing Stability and Tenant Protection Act (HSTPA) introduced new regulations that reversed decades of deregulation on the Real Estate Industry. It eliminated Vacancy decontrol (which permitted the deregulation of vacant rent-stabilized units) and Vacancy Bonuses, “a 20% bonus to the “legal” rent in between tenancies.”6 The law also tied preferential rent increases to a tenant’s current rent, limiting rent increases to 1.5% on one year leases and 2.5% on two year leases.6 These limitations still translate into exponential increases for New York City renters, half of whom are rent burdened (paying 30% or more of their income on housing).7
Despite protections the HSTPA offers, it also created loopholes. The ‘Frankenstein’ loophole permits landlords to increase the rents of rent-stabilized apartments by combining them to technically create new units, which removes them from rent-control. There are also no penalties for landlords who keep units perpetually vacant.5 Benjamin T. Teresa discusses the law for Metropolitics:
The 2019 reform should be understood as a new terrain for political struggle over housing, and that the trajectory of the struggle will again depend on how the state interprets and executes its enforcement role.
Teresa, 2021.
Vacancies are a part of the fabric of NYC housing and real estate. In order to understand this landscape, it is important to explore financialization and its impact on urban life.
Financialization
Financialization is an economic transformation initiated in the 1970s which deregulated financial markets, allowing a freer flow of capital into real estate and bolstering the influence of financial markets over government policy.7 8 Financialization has a dual impact: on the built environment and on public policy. Drozdz et al (2021) explain the key characteristics of financialization:
- National reforms to capital regulation making it easier to transfer capital between markets, paired with local tax incentives which funnel capital investment into public infrastructure projects.
- Institutional investors collect savings “from households, companies, and governments” while asset managers “[allocate] these investments in urban markets.”
- Land-ownership rights are transformed “into tradable financial assets.”8
Essentially, financialization transforms infrastructure (in the context of this investigation, housing and real estate) into assets to be bought and sold. The immense power of financial markets, fueled by deregulation and lobbying, influences housing policy in a way that favors developers and landlords. Because the interests of landowners and renters are diametrically opposed, renters face an immense disadvantage. Cheng (2022) explains that the real estate market is cyclical, with periods of “euphoria” and “crisis.”9
For investors, each stage whether high or low has the potential for profit or anticipated profit. On the other hand, for the tenants living in buildings owned by investors or an investment company, the cycle resembles more of a diagonal line of perpetual rent increases and absence of maintenance work being performed.
Cheng, 2022, p.1
The concept of financialization is complex with deep impacts on housing and real estate. The actual process of rental housing financialization is described by Cheng (2022). First, investors identify an area that has high potential for gentrification and purchase a building for more than it is worth at the time, a practice known as ‘property speculation.’ Then, the investors “wait it out” and may refinance their mortgage (replacing the original for one of a higher value and extracting the difference between the two), a process of “pulling out equity.” Ultimately, they can sell the building at a higher price point than what they purchased it for when the value increases (Cheng, 2022, p.2). This is a process that enriches investors while displacing residents from their homes.
The shift from local landlords to international investors, a key feature of real estate financialization, has detrimental impacts on tenants. Fields and Uffer (2014) explain that private equity funds cut costs on maintenance and other services to maximize profit which results in subpar living conditions, rising costs, and icing out low-income renters.10 They also connect the financialization of housing to residential vacancies:
In buildings funds purchased, housing advocates from community-based non-profit organisations observed increased vacancies and tenant turnover, followed by renovations and more affluent tenants especially in areas with large immigrant populations…
Fields & Uffer, 2014, p. 1495.
In this case, vacancies give landlords an opportunity to purge their buildings of lower income residents and jack up rents that cater to more affluent tenants.
Findings and conclusion
Residential vacancies are rampant in NYC, with 353,400 unavailable units in 2021.1 61,593 of these vacant and unavailable units were rent stabilized.2,5 The areas with the highest concentrations of residential vacancies are Midtown Manhattan, East Elmhurst and Jackson Heights. Residential vacancies have increased exponentially throughout the boroughs, specifically in Manhattan.
Financialization changes the fabric of cities by transforming real estate into tradeable assets, used by the financial sector as investment opportunities.7,8 International investors propel gentrification by purchasing buildings for a low cost and renovating or selling them to cater to more affluent residents, displacing low income renters.9,10
Investors and landlords benefit from residential vacancies through loopholes that allow them to deregulate rent-stabilized units and increase rents to market rate.8 Additionally, holding units off the market creates the mirage of a housing shortage which permits landlords to raise rents due to perceived scarcity. Withholding rent-stabilized units inflates the average median rent, which informs rents across the board.2
The findings of this analysis are limited due to unspecific measurements of the 2021 NYCHVS, which obscures neighborhoods that face the highest vacancy levels, the reasons for vacancies, and who owns the vacant units. The Social Explorer maps use federally collected data whereas the NYCHVS is conducted by the city. The different methodologies and different years the surveys were conducted make the two difficult to compare. However, Social Explorer does provide a visual representation of vacancies which the NYCHVS lacks, and shows change over time.
When the detailed data for the 2021 NYCHVS is released it is worth revisiting to uncover more specific information about residential vacancies. Exploring ways to measure which landlords have the highest number of vacancies would also illuminate the differences between local landlords and financial investors. Considering different ways to measure the level of financialization is another endeavor that would make it easier to compare vacancy levels to financial investment. Finally, looking into the zoning changes and legislation of neighborhoods identified as having high vacancy rates would unveil similar characteristics. A comparison of Midtown Manhattan and Jackson Heights, or a neighborhood with lower vacancy rates would be compelling.
Sources
1 2021 New York City Housing and Vacancy Survey: Selected Initial Findings (2022). The Department of Housing and Urban Development. link
2 Rabiyah, Sam (2022). “More than 60,000 Rent-Stabilized Apartments Are Now Vacant — and Tenant Advocates Say Landlords Are Holding Them for ‘Ransom.’” The City. link
3 Coalition for the Homeless (2022). “Basic Facts About Homelessness: New York City.” link
4 Coalition for the Homeless (2022). “How many total people are homeless in NYC?” link
5 Pascal, Woody (2022). Letter from Woody Pascal to Andrew McLaughlin. Obtained by The City. link
6 NYC Mayor’s Office to Protect Tenants (n/d). “New Protections for Rent-Regulated Tenants.” link
7 Drozdz, Martine, A. Guironnet, and L. Halbert (2019). “Cities in the Age of Financialization.” Metropolitics. link
8 Teresa, Benjamin F. (2019). “The Financialization of Rent-Regulated Housing in New York City after Rent Reform.” Metropolitics. link
9 Cheng, Jennifer (2022). Disrepair, Displacement and Distress: Finding Housing Stories Through Data Visualizations. CUNY Graduate Center. link
10 Fields, Desiree and S. Uffer (2016). “The financialisation of rental housing: A comparative analysis of New York City and Berlin.” Urban Studies Vol. 53(7) pp. 1486-1502. link
Leave a Reply